“Output fell compared with last week” can send a production meeting in the wrong direction. The plant may have scheduled fewer hours or made a different product. A correct total does not necessarily support the first explanation attached to it.
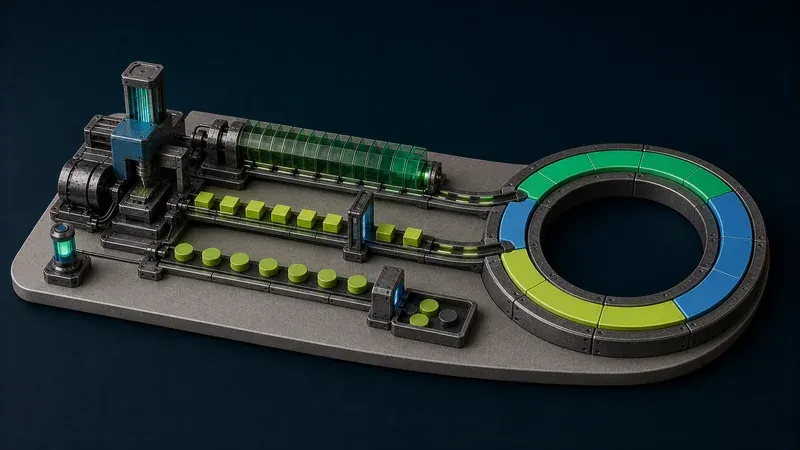
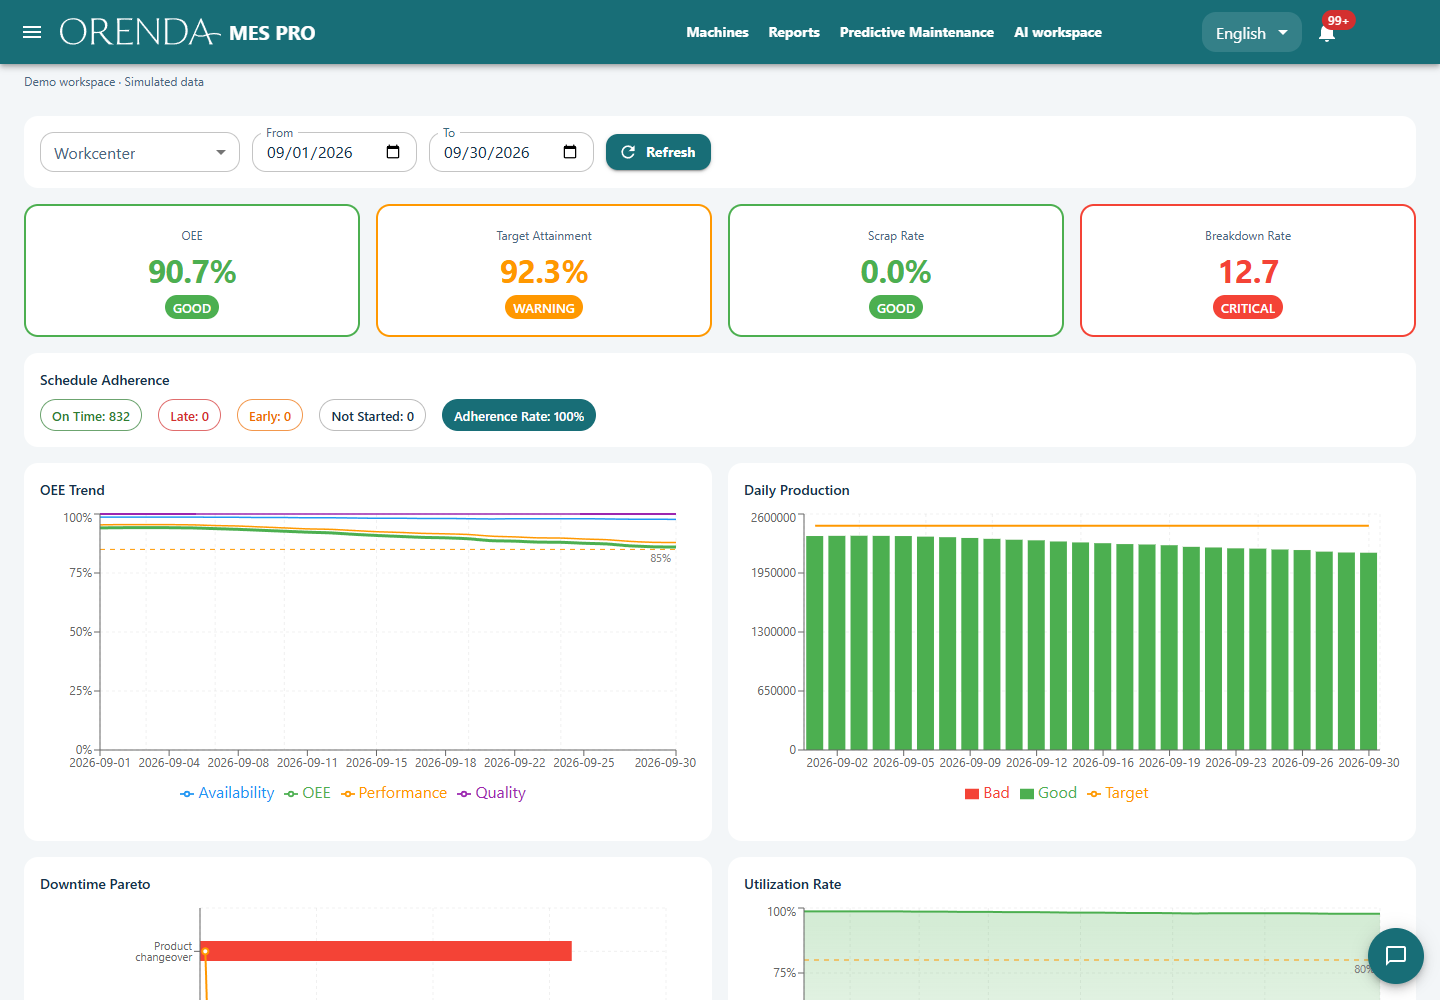
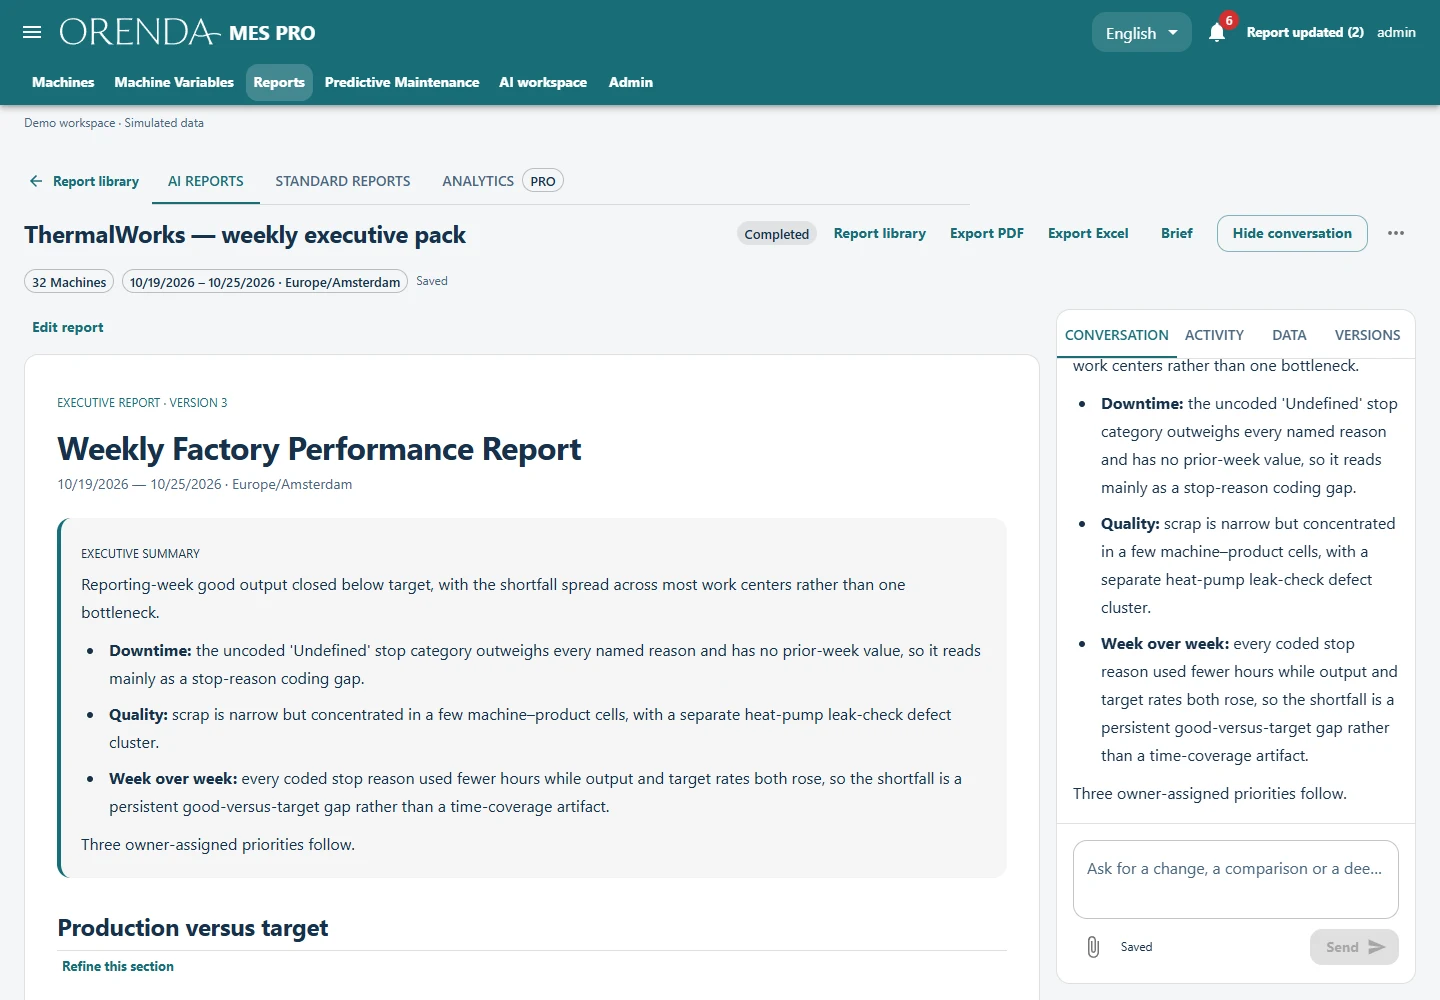
A useful weekly report connects the result to a decision, with enough detail to check the calculation and specific work to review next time. These figures are illustrative. Product images show Orenda’s simulated factory demonstration.
Compare the time behind the output
Consider two weeks with these records:
| Measure | Previous week | Latest week |
|---|---|---|
| Planned production time | 40 hours | 32 hours |
| Operating time | 32 hours | 28 hours |
| Total parts | 10,000 | 8,000 |
| Accepted parts | 9,600 | 7,840 |
| Rejected parts | 400 | 160 |
Accepted output fell by about 18.3%. Planned production time also fell by 20%. Accepted output per planned hour moved from 240 to 245 parts.
Availability increased from 80% to 87.5%, and the reject rate fell from 4% to 2%. Lower output does not automatically mean worse performance. These figures also do not establish higher machine speed or better quality for the same product: product mix and inspection conditions still matter.
A useful opening might say: “Fewer production hours were planned. Accepted output fell, while output per planned hour remained similar. The quality difference needs a product-level comparison.”
Establish the reporting boundaries
The scope might cover all machines, a department, or named workcenters. Explicit periods and plant timezones matter particularly for overnight shifts and several sites.
Orenda MES Reports provides production, downtime and analysis views for this review. Their calculation basis and source coverage matter when a production run crosses a reporting boundary. A quantity may describe the complete overlapping run, while stop duration is clipped to the selected interval. Those measures must not be assumed to use identical allocation rules.
The production report data checklist covers these unit and coverage checks in more detail.
Investigate what the loss report actually says
Suppose total stopped time fell from eight hours to four, but unclassified time rose from one hour to three. Now 75% of the latest week’s downtime has no recorded explanation.
The first action is not necessarily a maintenance repair. The production lead needs to identify those intervals and review the missing reasons. Operator notes, product changes and relevant machine readings may explain them. Substituting an alarm for a downtime reason would only hide the uncertainty.
Separating confirmed causes from unresolved records helps assign the right work to the right team.
Use AI Reports to follow the question
Orenda AI Reports keeps the report brief, selected sources, conversation and versions together. A report can start from an existing analysis, and selected information can be added to an existing report.
For this example, the initial request could compare output, downtime and rejects while explaining unequal production hours. Follow-up questions can then ask which machines account for the three unclassified hours, or whether the reject rate changed for the same product.
Opening a report’s sources lets the reviewer inspect its units, period and contributing records. PDF supports reading and sharing; Excel supports detailed review of the tables and calculations. Retained versions also show which result the previous meeting used.
Leave the meeting with checkable work
“Improve efficiency” is not a task someone can close. The example supports three more useful actions:
- Production reviews the longest unclassified stops with the relevant shift and completes their records.
- Quality checks whether the reject-rate change comes from product mix or a change within the same product.
- Planning reviews how fewer scheduled hours affect delivery commitments.
Owners and review dates belong in the team’s work record. A recommendation does not itself create a maintenance order or change a machine setting.
Orenda AI Reports supports templates and configured daily or weekly schedules with approved source access and available AI allowance. At the next meeting, the first question is what happened to the previous actions. Bring that recurring decision to an AI Reports demo, rather than starting with a list of desired charts.